The biotech space is full of expectations and sudden surprises. Every week companies publish clinical
results or FDA decisions that can move a stock sharply in both directions. The run-up biotech
is the phase before these events, when the market starts to price in possible good news and the price
moves before the announcement. This guide explains how to recognize and follow these moves with a more
structured and cautious approach.
The aim here is to describe a way to observe and structure trades around catalysts, not to predict outcomes
or suggest specific stocks to buy or sell.
1. What is Run-Up Biotech
The run-up is the price increase of a biotech stock ahead of a key event. Market participants buy
in advance because they expect a positive outcome. When the event arrives, many lock in gains and the price
can retrace sharply. Sometimes the run-up is followed by a “sell the news” reaction even after good data.
The core idea of the framework is simple: try to capture part of the price discovery
before the binary event, and reduce risk before the moment where the
result is unknown and potentially violent.
2. Where to Find Catalysts
Catalysts are the events that can trigger a repricing. Typical examples:
PDUFA dates and other FDA decision deadlines on NDA/BLA filings.
Top-line results from Phase 2 or Phase 3 trials (especially registrational trials).
Interim analyses with predefined statistical boundaries.
Type A/B meetings or formal feedback after a Complete Response Letter (CRL).
Label expansions and supplemental filings (sNDA/sBLA).
The most useful sources include the
Merlintrader Catalyst Calendar
,
which lists expected dates for clinical readouts, FDA decisions and conferences. Tagging stocks with
upcoming events is the first step to building a focused run-up watchlist.
Clear, dated eventBinary outcome riskGap risk at the announcement
3. Preferred Profile for Run-Up Candidates
Not every biotech with a catalyst is a good run-up name. The framework does not exclude anything, but
there are profiles that are generally preferable because they tend to move more cleanly
when volume arrives.
3.1 Capital structure and float
Reasonable float: stocks with a moderate float (for example tens of millions of
shares, not hundreds of millions) usually react more visibly when volume increases.
Not ultra-micro float: extremely tiny floats can move violently but are often
difficult to trade and more exposed to manipulation. The framework prefers liquidity over lottery
behavior.
Clean share structure: ideally limited overhang from toxic convertibles, massive
warrants or very recent heavily dilutive offerings.
Short interest: a moderate short interest can contribute to run-ups; extremely
high short interest adds complexity and can make moves very unstable.
3.2 Historical reaction to past catalysts
Look back at previous trial readouts, earnings with guidance, and FDA milestones:
did the stock show large spikes in the past, or did it trade flat?
Names that historically produce 30–50% moves around news (up or down) tend to
react more strongly when the market prepares for a new event.
If previous catalysts attracted little interest and volume never expanded, it is less likely that
a new catalyst will suddenly generate a clean run-up, unless the context has clearly changed
(partnership, new data, different indication).
3.3 Weight and nature of the catalyst
Phase 1: usually safety and PK/PD; moves are possible but often more speculative
and less “structured”.
Phase 2: proof-of-concept and signal detection; often good run-up candidates if
the indication is meaningful and data could change the story.
Phase 3: registrational; market attention is much higher, and run-ups can be
substantial because the result may directly impact future revenue expectations.
PDUFA / final FDA decision: usually the highest attention event. Run-ups tend to
be watched not only by biotech specialists, but also by broader momentum traders.
3.4 Resubmissions after a CRL (Complete Response Letter)
When a company receives a CRL and later files a resubmission, the market often
looks at how much of the original issue has been addressed (manufacturing, trial design, safety,
missing data, etc.).
A clear resubmission with well-defined fixes, especially if the issues were “addressable” and
not fundamental efficacy failures, can create a narrative of “return to the pre-CRL story”.
In several cases, if confidence in the resubmission grows, the price tends to drift back toward
levels closer to those seen before the CRL shock, even if it does not necessarily retest them
exactly.
The framework therefore pays attention to:
manufacturing-only CRLs, label or REMS discussions, missing inspections, versus deep doubts on
efficacy or safety.
The presence of these characteristics does not guarantee a successful run-up, but they increase the
probability that price and volume will respond in a way that is tradable with defined risk.
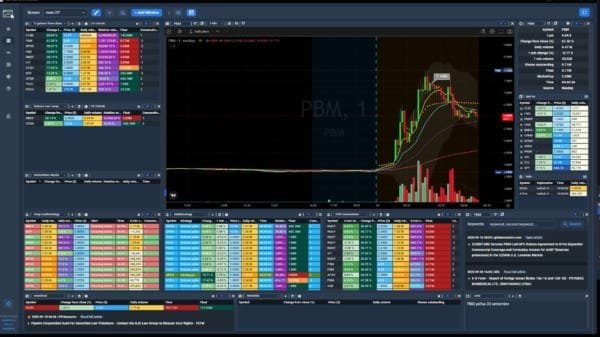
4. Essential Tools
You do not need dozens of platforms. A compact toolkit is enough:
Finviz – for daily charts, volume profiles, float information and quick filters
(sector, market cap, performance).
Medved Trader – to monitor intraday behavior, liquidity in the book and tape, and
to execute entries/exits with more precision.
ChartsWatcher – useful when intraday activity becomes intense; alerts can signal
when a name on the catalyst list suddenly wakes up.
The goal is not to become a pure chartist, but to learn to read signs of
growing interest and expanding liquidity around a known future event.
5. When to Enter and Exit
In many cases a rough structure can help:
2–3 months before: observation phase; map catalysts, read filings and build a watchlist.
4–6 weeks before: potential start of the move, especially if volume and sentiment start to rise.
1–3 weeks before: often the most active part of the run-up, but also the most crowded.
Exit: preferably before the official news is released, at a point defined in advance.
Waiting for the event can expose the trader to sudden gaps against the position. Accepting to exit early,
even leaving some upside on the table, is often more consistent with capital protection, especially when
the catalyst is binary and the stock has already moved a lot.
6. Risk Management
Risk should never be concentrated on a single binary event. Diversifying positions, limiting size, and
defining a maximum tolerable loss per idea are central parts of this framework. Biotech stocks can be
very volatile: the objective is to participate in price discovery without assuming that the outcome will
match expectations.
Use smaller position sizes on names with thin float or history of extreme gaps.
Avoid adding size purely because “the event is close”; respect your initial plan.
Consider scaling out gradually instead of trying to catch the absolute top of the run-up.
7. Recent Examples
Below two real examples of run-up biotech behavior in 2024–2025. They are not recommendations, only
illustrations of the pattern:
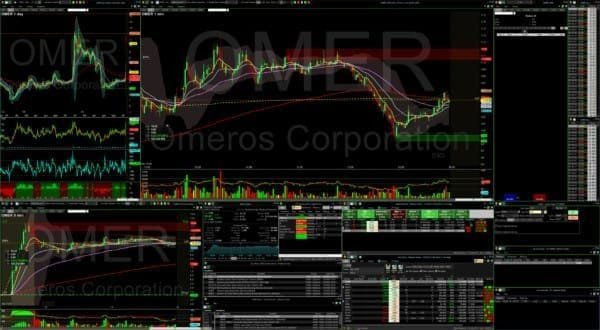
AGIO – Moderate run-up ahead of clinical updates, followed by a sharp retracement after disappointing data.
NUVB – Run-up before the IBTROZI FDA decision, with strong repricing after the positive outcome.
8. BioTrader Routine
Review the catalyst calendar once a week and refresh the list of upcoming events.
Select a small group of names with catalysts in the next 1–3 months.
Study chart and volumes on Finviz to see if interest and liquidity are starting to increase.
Consider entries only when price, volume and sentiment begin to align with the thesis.
Scale out before the event instead of waiting for the exact headline time.
9. Right Mindset
A run-up framework works only if it is applied with discipline. The objective is not to chase every move,
but to build a repeatable process that respects risk. Protecting capital over the long term is more
important than capturing every single opportunity.
The reality is that not all catalysts will generate a clean run-up. Some will be crowded and choppy,
others will remain quiet. The method is to prepare, observe and act only when the pieces line up,
not to force trades because a date appears on a calendar.
10. Useful Resources
Finviz.com –
Stock charts, float data and screeners.
MedvedTrader.com –
Real-time trading platform and advanced charting.
Run-up biotech is not a promise of profits, but a way to structure how you look at catalysts and price
behavior. With a limited set of tools and clear rules, it becomes easier to follow the most active phases
of the sector while keeping risk under more explicit control.
Observe, plan, act with size you can tolerate, and close before the binary event:
this is the core idea of the Run-Up Biotech 2025 framework.
Sources and References
This framework is based on public information from official company filings, FDA calendars and press
releases, combined with personal observation of price behavior around catalysts in recent years.
For detailed data on individual tickers, always refer to:
Company investor relations pages and SEC filings.
FDA official communications and drug approval calendars.
Primary news feeds from major financial news outlets.
Run-Up Biotech 2025 — Guida pratica ai catalyst biotech
Guida pratica per seguire i movimenti del biotech riducendo il rischio
Il mondo biotech è pieno di aspettative e di sorprese improvvise. Ogni settimana le aziende pubblicano
risultati clinici o decisioni FDA che possono far muovere un titolo in modo molto netto. Il
run-up biotech è la fase che precede questi eventi, quando il mercato inizia a prezzare
possibili buone notizie e il prezzo si muove prima dell’annuncio ufficiale. Questa guida spiega come
riconoscere e seguire questi movimenti con un approccio più strutturato e prudente.
L’obiettivo è descrivere un modo per osservare e strutturare operazioni intorno ai catalyst, non prevedere
gli esiti né suggerire titoli da comprare o vendere.
1. Cos’è il Run-Up Biotech
Il run-up è la salita del prezzo di un titolo biotech in vista di un evento chiave. Il mercato
acquista in anticipo perché si aspetta un esito favorevole. Quando l’evento arriva, molti chiudono le
posizioni e il prezzo può ritracciare in modo brusco. A volte il run-up è seguito da una fase di
“sell the news” anche dopo dati positivi.
L’idea di fondo del framework è semplice: provare a catturare una parte della fase di
price discovery prima dell’evento binario, riducendo il rischio
prima del momento in cui il risultato è sconosciuto e potenzialmente violento.
2. Dove trovare i catalyst
I catalyst sono gli eventi che possono portare a un cambiamento di valutazione. Alcuni esempi:
Date PDUFA e altre scadenze per decisioni FDA su NDA/BLA.
Top-line di studi di Fase 2 o Fase 3 (soprattutto registrativi).
Analisi ad interim con confini statistici predefiniti.
Type A/B meeting o feedback formale dopo una Complete Response Letter (CRL).
Espansioni di indicazione e depositi supplementari (sNDA/sBLA).
Tra le fonti più utili c’è il
Calendario Catalyst Merlintrader
,
che riporta le date attese per letture di dati clinici, decisioni FDA e conferenze. Segnare i titoli
con eventi in arrivo è il primo passo per costruire una watchlist mirata al run-up.
Evento chiaro e databileRischio di esito binarioRischio gap alla notizia
3. Profilo preferibile per i titoli da Run-Up
Non ogni biotech con un catalyst è un buon candidato da run-up. Il framework non esclude a priori
nessuno, ma ci sono profili generalmente preferibili perché tendono a muoversi in modo
più leggibile quando entra volume.
3.1 Struttura azionaria e float
Float ragionevole: titoli con un float medio (per esempio decine di milioni di
azioni, non centinaia di milioni) di solito reagiscono in modo più visibile quando aumentano i volumi.
Non micro-float estremi: float minuscoli possono muoversi in modo violento ma
spesso sono difficili da tradare e più esposti a manipolazioni. Il framework privilegia la
liquidità rispetto al comportamento “lotteria”.
Struttura pulita: idealmente poco overhang da convertibili tossici, warrant
massivi o aumenti di capitale pesanti molto recenti.
Short interest: uno short interest moderato può contribuire al run-up; livelli
eccessivi aggiungono complessità e rendono il movimento più instabile.
3.2 Reazione storica ai precedenti catalyst
Guardare a come si è mosso il titolo in passato su letture dati, trimestrali con
guidance, milestone FDA: ha fatto spike importanti o è rimasto piatto?
I nomi che storicamente producono movimenti del 30–50% intorno alle news (su o giù)
tendono a reagire in modo più deciso quando il mercato si prepara a un nuovo evento.
Se ai catalyst precedenti il titolo non ha attirato interesse e i volumi non sono mai esplosi,
è meno probabile che un nuovo catalyst generi improvvisamente un run-up pulito, a meno che
il contesto non sia cambiato in modo evidente (nuovi partner, nuovi dati, diversa indicazione).
3.3 Peso e natura del catalyst
Fase 1: in genere safety e PK/PD; i movimenti sono possibili ma spesso più
speculativi e meno “strutturati”.
Fase 2: proof-of-concept; spesso buoni candidati da run-up se l’indicazione è
significativa e i dati possono cambiare la percezione della pipeline.
Fase 3: studi registrativi; l’attenzione del mercato è molto più alta e i run-up
possono essere importanti perché il risultato impatta direttamente le aspettative di ricavi futuri.
PDUFA / decisione FDA finale: di solito l’evento con più attenzione. I run-up
vengono seguiti non solo dagli specialisti biotech, ma anche da molti trader di momentum.
3.4 Resubmission dopo CRL (Complete Response Letter)
Quando un’azienda riceve una CRL e in seguito presenta una resubmission, il
mercato guarda a quanto il problema originario sia stato risolto (manifattura, design dello studio,
safety, dati mancanti, ecc.).
Una resubmission chiara, con correzioni ben definite, soprattutto se i problemi erano
“affrontabili” e non legati a fallimento di efficacia, può creare una narrativa di
“ritorno alla storia pre-CRL”.
In diversi casi, se cresce la fiducia nella resubmission, il prezzo tende a muoversi di nuovo verso
l’area dei livelli visti prima dello shock da CRL, anche se non necessariamente li ritesta in modo
perfetto.
Il framework presta quindi molta attenzione al tipo di CRL: solo CMC/manifattura, etichetta/REMS,
ispezioni, oppure dubbi profondi su efficacia o safety.
La presenza di queste caratteristiche non garantisce un run-up di successo, ma aumenta la probabilità
che prezzo e volumi reagiscano in modo tradabile con un rischio definito.
4. Strumenti essenziali
Non servono decine di piattaforme. Un set di strumenti compatto è sufficiente:
Finviz – per grafici daily, dati sul float, volumi e filtri rapidi
(settore, market cap, performance).
Medved Trader – per monitorare l’intraday, book e tape, e gestire ingressi/uscite
con maggiore precisione.
ChartsWatcher – utile quando l’attività intraday diventa intensa; gli alert
segnalano quando un titolo in lista catalyst si “accende”.
L’obiettivo non è diventare analisti tecnici puri, ma imparare a leggere i segnali di
interesse crescente e liquidità in espansione attorno a un evento noto.
5. Quando entrare e uscire
In molti casi una struttura di base può aiutare:
2–3 mesi prima: fase di osservazione; mappare i catalyst, leggere i filing e costruire la watchlist.
4–6 settimane prima: possibile inizio del movimento, soprattutto se iniziano a crescere volumi e interesse.
1–3 settimane prima: spesso la fase più attiva del run-up, ma anche la più affollata.
Uscita: preferibilmente prima della pubblicazione della notizia, in un punto definito a priori.
Aspettare l’evento espone spesso a gap improvvisi contro la posizione. Accettare di uscire in anticipo,
lasciando eventualmente qualcosa sul tavolo, è spesso più coerente con la protezione del capitale,
soprattutto quando il catalyst è binario e il titolo si è già mosso molto.
6. Gestire il rischio
Il rischio non andrebbe concentrato su un singolo evento binario. Diversificare le posizioni, limitare
la size e definire una perdita massima tollerabile per idea sono elementi centrali del framework. I
titoli biotech possono essere molto volatili: l’obiettivo è partecipare alla fase di price discovery
senza dare per scontato che l’esito coincida con le aspettative.
Usare size più piccole sui titoli con float sottile o storico di gap estremi.
Evitare di aumentare la size solo perché “l’evento è vicino”; rispettare il piano iniziale.
Valutare uscite graduali invece di cercare il massimo assoluto del run-up.
7. Esempi recenti
Di seguito due esempi reali di comportamento da run-up biotech nel periodo 2024–2025. Non sono inviti
all’acquisto, ma semplici illustrazioni del pattern:
AGIO – Run-up moderato prima di aggiornamenti clinici, seguito da un forte ritracciamento dopo dati deludenti.
NUVB – Run-up prima della decisione FDA su IBTROZI, con forte riprezzamento dopo l’esito positivo.
8. Routine del BioTrader
Controllare il calendario catalyst una volta a settimana e aggiornare la lista degli eventi in arrivo.
Scegliere un gruppo ristretto di titoli con catalyst nei prossimi 1–3 mesi.
Studiare grafico e volumi su Finviz per capire se si sta formando interesse e liquidità.
Valutare ingressi solo quando prezzo, volumi e sentiment iniziano ad allinearsi con la tesi.
Uscire in modo progressivo prima dell’evento, invece di attendere il titolo di stampa.
9. Mentalità giusta
Un framework di run-up funziona solo se applicato con disciplina. L’obiettivo non è inseguire ogni
movimento, ma costruire un processo ripetibile che rispetti il rischio. La protezione del capitale nel
lungo periodo è più importante del tentativo di catturare ogni singola opportunità.
La realtà è che non tutti i catalyst genereranno un run-up pulito. Alcuni saranno affollati e nervosi,
altri rimarranno piatti. Il metodo è prepararsi, osservare e agire solo quando i pezzi si
incastrano, non forzare trade solo perché una data compare in calendario.
Conclusione
Il run-up biotech non è una promessa di guadagno, ma un modo più ordinato di osservare catalyst e
comportamento dei prezzi. Con pochi strumenti e alcune regole chiare diventa più semplice seguire le
fasi più attive del settore mantenendo un controllo più esplicito del rischio.
Osserva, pianifica, utilizza size sostenibili e chiudi prima dell’evento binario:
questa è l’idea centrale del framework Run-Up Biotech 2025.
Fonti e riferimenti
Questo framework si basa su informazioni pubbliche provenienti da documenti societari ufficiali,
calendari FDA e comunicati stampa, combinate con osservazione diretta del comportamento dei prezzi
intorno ai catalyst negli ultimi anni. Per i dati di dettaglio sui singoli titoli fai sempre
riferimento a:
Pagine investor relations delle società e filing SEC corrispondenti.
Comunicazioni ufficiali FDA e calendari delle decisioni sui farmaci.
Flussi news delle principali testate finanziarie.
Biotech Catalyst Calendar
To explore upcoming FDA decisions, clinical readouts and key biotech events followed in this framework,
you can refer to the dedicated calendar page on Merlintrader trading Blog.
Open the Biotech Catalyst Calendar
Per fornire le migliori esperienze, noi e i nostri partner utilizziamo tecnologie come i cookie per memorizzare e/o accedere alle informazioni del dispositivo. Il consenso a queste tecnologie permetterà a noi e ai nostri partner di elaborare dati personali come il comportamento durante la navigazione o gli ID univoci su questo sito e di mostrare annunci (non) personalizzati. Non acconsentire o ritirare il consenso può influire negativamente su alcune caratteristiche e funzioni.
Clicca qui sotto per acconsentire a quanto sopra o per fare scelte dettagliate. Le tue scelte saranno applicate solamente a questo sito. È possibile modificare le impostazioni in qualsiasi momento, compreso il ritiro del consenso, utilizzando i pulsanti della Cookie Policy o cliccando sul pulsante di gestione del consenso nella parte inferiore dello schermo.
Funzionale
Sempre attivo
L'archiviazione tecnica o l'accesso sono strettamente necessari al fine legittimo di consentire l'uso di un servizio specifico esplicitamente richiesto dall'abbonato o dall'utente, o al solo scopo di effettuare la trasmissione di una comunicazione su una rete di comunicazione elettronica.
Preferenze
L'archiviazione tecnica o l'accesso sono necessari per lo scopo legittimo di memorizzare le preferenze che non sono richieste dall'abbonato o dall'utente.
Statistiche
L'archiviazione tecnica o l'accesso che viene utilizzato esclusivamente per scopi statistici.L'archiviazione tecnica o l'accesso che viene utilizzato esclusivamente per scopi statistici anonimi. Senza un mandato di comparizione, una conformità volontaria da parte del vostro Fornitore di Servizi Internet, o ulteriori registrazioni da parte di terzi, le informazioni memorizzate o recuperate per questo scopo da sole non possono di solito essere utilizzate per l'identificazione.
Marketing
L'archiviazione tecnica o l'accesso sono necessari per creare profili di utenti per inviare pubblicità, o per tracciare l'utente su un sito web o su diversi siti web per scopi di marketing simili.